|
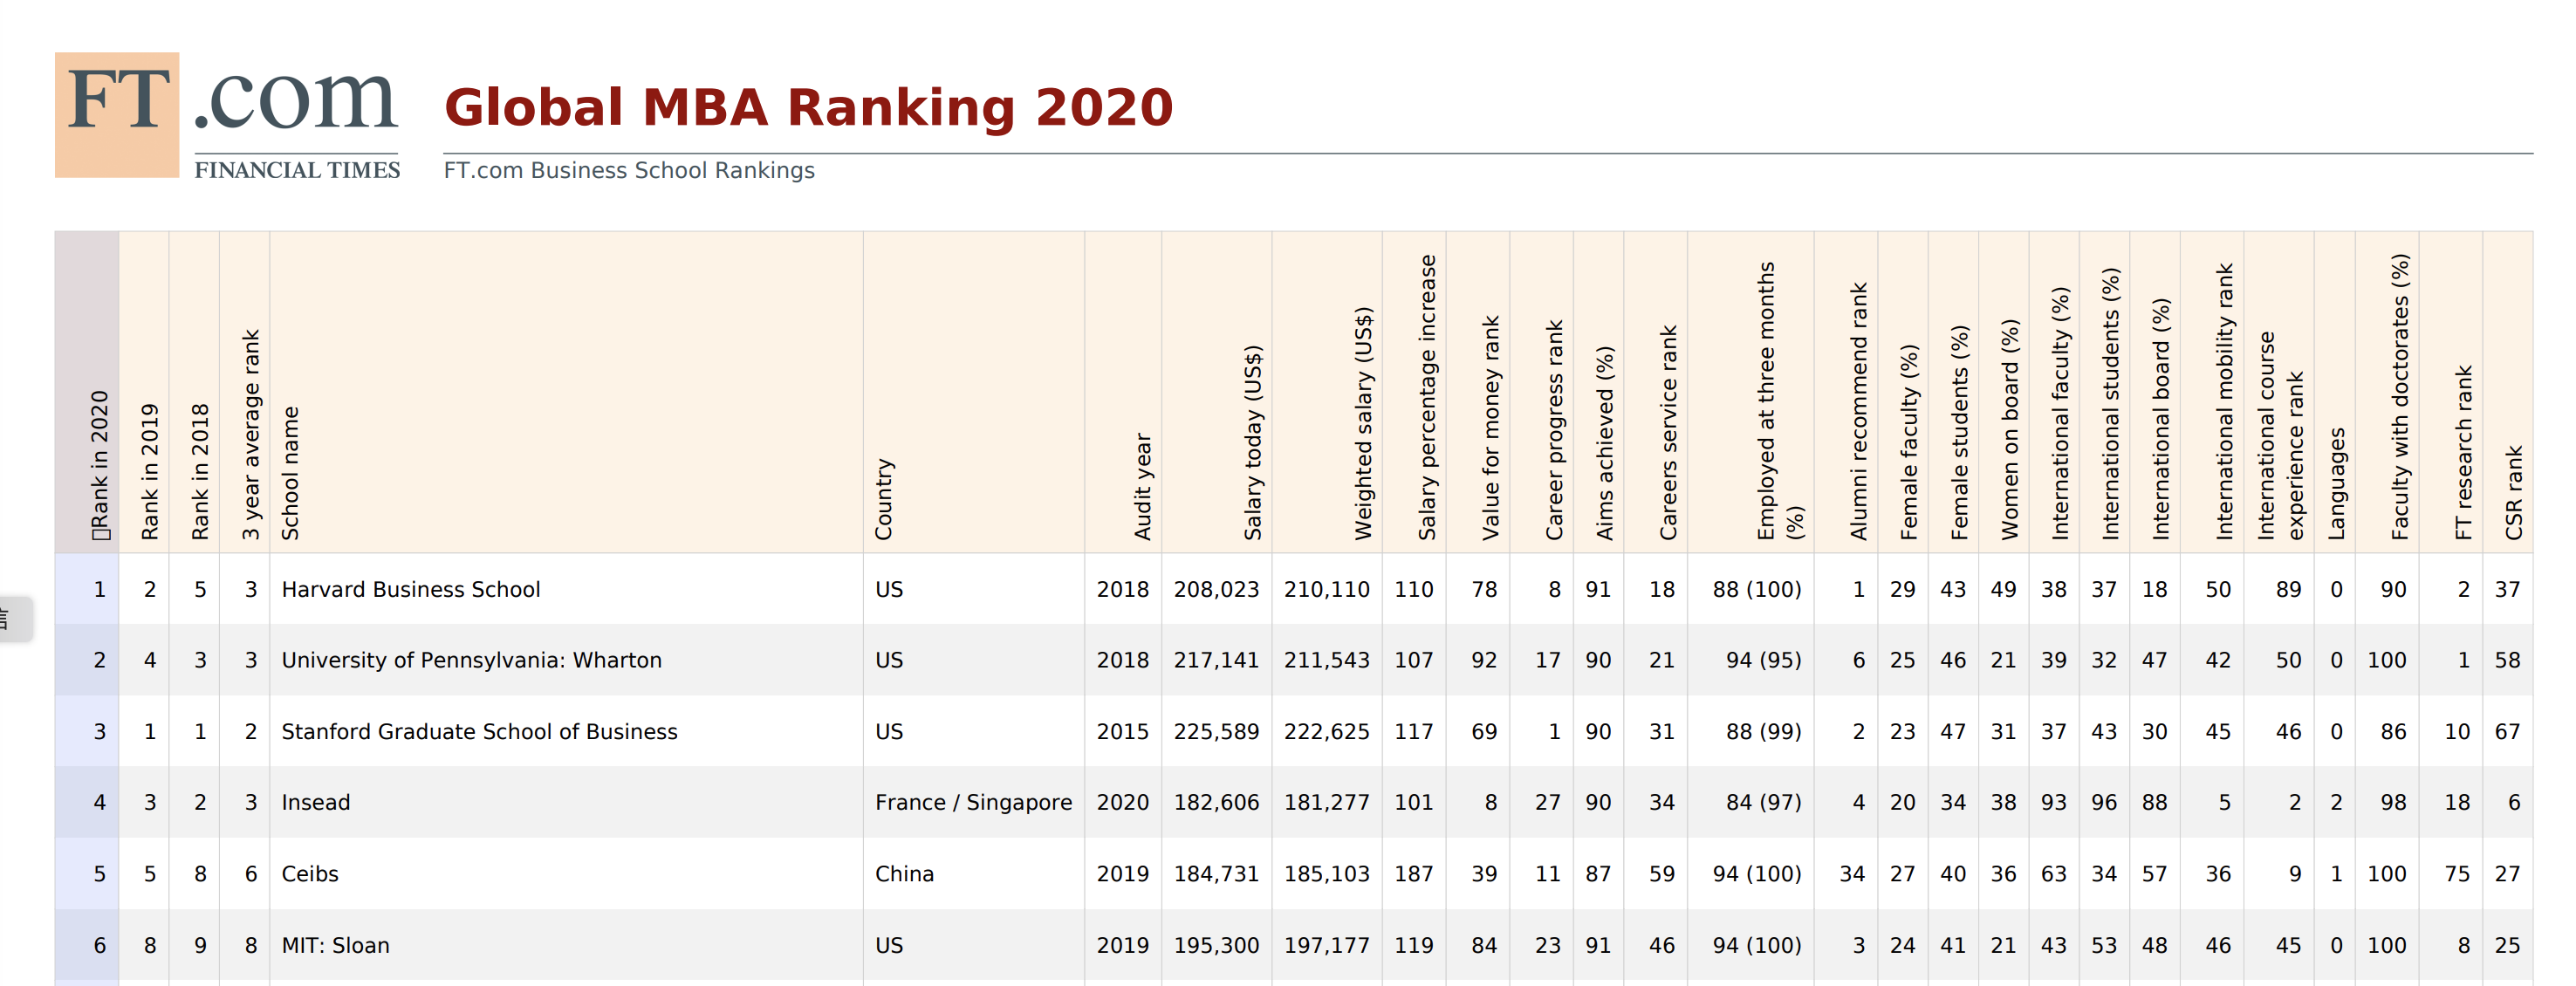
This ranking features the world’s best 100 full-time MBA programmes. A total of 156 schools took part in the 2020 edition. All participating schools meet the FT’s entry criteria, including being accredited by Equis or the AACSB.
The FT surveys alumni three years after completing their MBA. For schools to enter the ranking calculations, the FT requires that a minimum of 20 per cent of alumni reply to the survey, with at least 20 fully completed surveys per school. About 7,920 from the class of 2016 completed our survey — a response rate of 38 per cent.
The ranking has 20 different criteria. Alumni responses inform eight criteria that together hold a weight of 61 per cent. Eleven criteria are calculated from school data, accounting for 29 per cent of the ranking. KPMG audits a number of schools every year. The remaining criterion, the research rank, counts for 10 per cent.
Alumni-informed criteria are based on data collected over three years. Responses from the 2020 survey carry 50 per cent of total weight and those from 2019 and 2018, 25 per cent each. If only two years of data are available, the weighting is split 60:40 if data are from 2020 and 2019, or 70:30 if they are from 2020 and 2018. For salary figures, the weighting is 50:50 for two years’ data.
The first two alumni criteria are average income three years after graduation and salary increase compared with pre-MBA salary, both weighted at 20 per cent. For the latter, half of the weight applies to the absolute increase and half to the percentage rise (published). Current salaries are converted to US dollars using November 2019 International Monetary Fund purchasing power parity rates.
The salaries of non-profit and public sector workers and full-time students are removed, as are the highest and lowest salaries from each school, to calculate a normalised average. Finally, salaries are weighted to reflect differences between different sectors.
“Value for money” for each school is calculated by dividing their average alumni salary three years after graduation by their MBA’s total cost, including tuition, lost salary, opportunity cost and other expenses. Any financial help given to alumni is subtracted from the total.
The FT also collects information from schools on their current faculty, newly enrolled students and the latest graduating class. School criteria include the diversity of staff, board members and students by gender, nationality and the MBA’s international reach. For gender criteria, schools with a 50:50 composition score highest.
The research rank is based on the number of articles by full-time faculty in 50 internationally recognised academic and practitioner journals. The rank combines the number of publications from January 2017 to August 2019, with the number weighted relative to faculty size.
The corporate social responsibility rank is based on the proportion of teaching hours from core courses dedicated to CSR, ethics, social and environmental issues. It carries a weight of 3 per cent.
The FT Global MBA ranking is a relative listing. Schools are ranked against each other by calculating a Z-score for each criterion. The Z-score is a statistic that shows where a score lies in relation to the mean. These scores are then weighted as outlined in the ranking key and added together for a final score.
After removing schools that did not meet the response rate threshold from the alumni survey, a first version is calculated using all remaining schools. The school at the bottom is removed and a second version is calculated and so on until we reach the top 100. The top 100 schools are ranked accordingly to produce the 2020 list.
Judith Pizer of Jeff Head Associates acted as the FT’s database consultant. The FT research rank was calculated using Clarivate Analytics data from the Web of Science, an abstract and citation database of research literature.
Key
(weights for ranking criteria are shown in brackets as a percentage of the overall ranking.)
Salary today: average alumnus salary three years after graduation, US$ PPP equivalent. This figure is not used in the ranking.†
Weighted salary (20): average alumnus salary three years after graduation, US$ PPP equivalent, with adjustment for variations between sectors.†
Salary increase (20): average difference in alumni salary before the MBA to now. Half of this figure is calculated according to the absolute salary increase, and half according to the percentage increase relative to pre-MBA salary — the “salary percentage increase” figure in the table.
Value for money (3): calculated using salary today, course length, tuition and other costs, including lost income during the MBA.†
Career progress (3): calculated according to changes in the level of seniority and the size of company alumni are working in now, compared with before their MBA.†
Aims achieved (3): the extent to which alumni fulfilled their stated goals or reasons for doing an MBA.†
Careers service (3): effectiveness of the school careers service in terms of career counselling, personal development, networking events, internship search and recruitment, as rated by their alumni.†
Employed at three months (2): percentage of the most recent graduating class who had found employment or accepted a job offer within three months of completing their studies. The figure in brackets is the percentage of the class for which the school was able to provide employment data, and is used to calculate the school’s final score in this category.
Alumni recommend (3): calculated according to selection by alumni of three schools from which they would recruit MBA graduates.†
Female faculty (2): percentage of female faculty.
Female students (2): percentage of female students on the full-time MBA.
Women board (1): percentage of female members on the school’s advisory board.
International faculty (4): calculated according to the diversity of faculty by citizenship and the percentage whose citizenship differs from their country of employment — the figure published in the table. ‡
International students (4): calculated according to the diversity of current MBA students by citizenship and the percentage whose citizenship differs from the country in which they study — the figure in the table. ‡
International board (2): percentage of the board whose citizenship differs from the country in which the school is based.
International mobility (6): based on alumni citizenship and the countries where they worked before their MBA, on graduation and three years after graduation.
International course experience (3): calculated according to whether the most recent graduating MBA class completed exchanges, credited short classes, study tours and company internships in countries other than where the school is based.
Languages (1): number of extra languages required on completion of the MBA.
Faculty with doctorates (5): percentage of full-time faculty with a doctoral degree.
FT research rank (10): calculated according to the number of articles published by current full-time faculty members in 50 selected academic and practitioner journals between Jan 2017 and Aug 2019. The FT50 rank combines the absolute number of publications with the number weighted relative to the faculty’s size.
Corporate Social Responsibility (3): proportion of teaching hours from core courses dedicated to CSR, ethics, social and environmental issues.
Schools with a 50:50 (male/female) composition receive the highest possible score in the three gender-related criteria.
† Includes data for the class of 2016 and one or two preceding classes where available.
* Graduated between July 2018 and June 2019.
‡ While we recognise the distinction between Chinese and Taiwanese scholars and students, within China no such distinction may have been observed when recording diversity.
Judith Pizer of Jeff Head Associates acted as the FT’s database consultant. The FT research rank was calculated using Clarivate Analytics data from the Web of Science, an abstract and citation database of research literature.
| 


 [复制链接]


 京公网安备11010202008513号 京ICP证101109号 京ICP备12012021号


 发表于 2020-1-27 09:34:40

 收藏
收藏 收藏
收藏


 楼主
楼主 发表于 2020-1-27 10:18:05

 发表于 2020-1-27 11:22:39


